
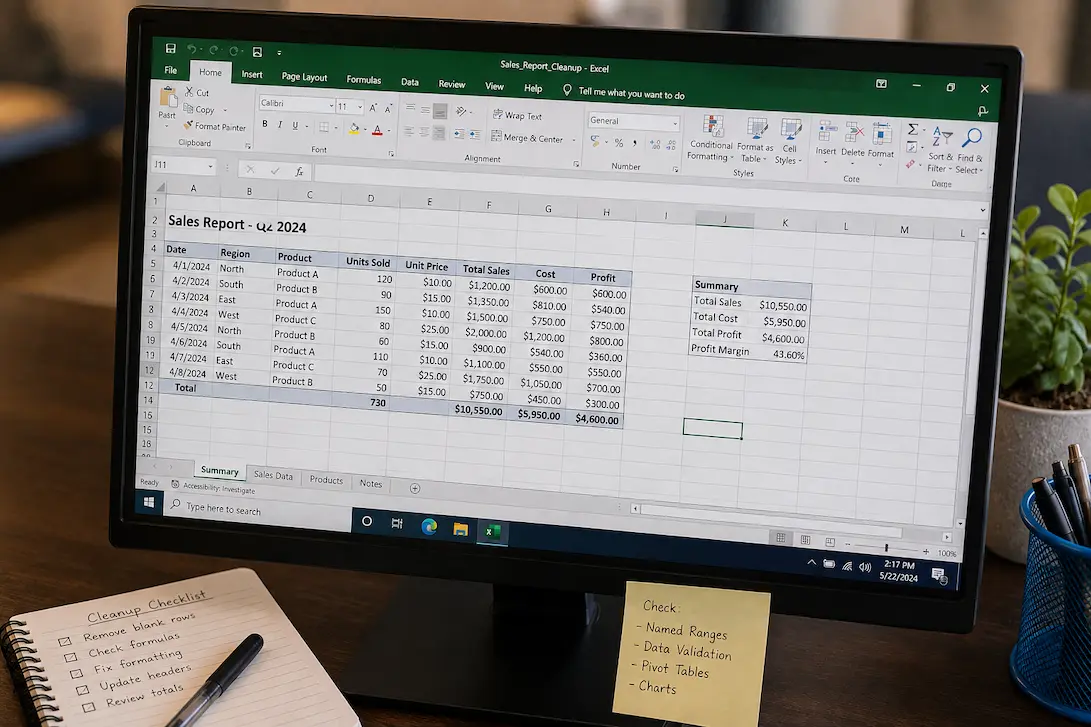
An Excel worksheet can become difficult to work with long before anything is technically broken. Extra formatting, unnecessary blank rows, inconsistent headings, duplicated information, old records, and scattered calculations can gradually turn a useful workbook into something that feels harder to maintain every time it is opened. The difficult part is that not everything that looks unnecessary is actually unnecessary. A blank-looking cell may be part of a formula range, a hidden column may support a calculation, and a formatting rule may be helping someone identify important values. Cleaning an Excel worksheet safely therefore means improving its organization without disturbing the relationships that make the workbook function.
The safest approach is to treat cleanup as an inspection and maintenance task rather than a deletion exercise. Before removing anything, create a working copy and identify the formulas, tables, named ranges, hidden areas, charts, validation rules, and other features that may depend on the worksheet. Once you know what is connected, you can address obvious clutter without guessing. This is especially important when the workbook is used for financial reports, inventory, project tracking, customer records, or any other work where a small spreadsheet mistake can affect later decisions.
Start by Understanding the Worksheet
Before changing the worksheet, look at it as a complete system rather than focusing on the cells that look messy. Identify where the main data begins and ends, which columns contain formulas, whether the sheet contains Excel Tables, and whether there are summary areas above or beside the main dataset. Check for hidden rows and columns as well because they may contain supporting calculations that aren’t immediately visible. If the workbook has several worksheets, consider whether the sheet you are cleaning feeds information into another part of the file. Spending a few minutes mapping the situation out can prevent you from deleting something simply because its purpose isn’t obvious.
It is also worth checking whether the worksheet contains features that aren’t visible from the normal grid. Named ranges, data validation, conditional formatting, charts, pivot tables, hyperlinks, and formulas referencing other sheets can all affect how safely you can reorganize the file. You don’t have to document every dependency before beginning, but you should know whether you’re dealing with a simple list or a workbook that functions more like a small reporting system. The more interconnected the spreadsheet is, the more conservative your cleanup should be.
Make a Copy Before You Clean
Always create a separate working copy before making structural changes to an important workbook. Saving a copy gives you a known-good version to compare against if something unexpected happens, and it is considerably safer than relying on the Undo command after a long series of changes. If the file is stored in OneDrive, SharePoint, or another service that provides version history, make sure you know how to access earlier versions as well. For particularly important spreadsheets, keep the original untouched until the cleaned version has been thoroughly checked.
A useful habit is to give the working copy a clear name rather than simply saving over the original. Something such as Inventory-Report-Cleanup.xlsx makes it obvious which file is being modified. This also helps when several people work with the same spreadsheet and prevents an unfinished cleanup from accidentally becoming the version everyone else uses. The extra minute spent creating a safe copy can save considerably more time if a formula or reference is affected later.
Separate Visual Clutter From Structural Problems
Not every untidy part of an Excel worksheet needs to be removed. Some elements exist for a reason even if their purpose isn’t immediately obvious. A blank row might separate two reporting sections, a colored cell might indicate an input field, and a hidden column might contain a helper calculation. Before deleting anything, ask whether the element is actually causing a problem or whether it simply looks different from the rest of the sheet.
This distinction is particularly important when cleaning formatting. A worksheet can certainly benefit from consistent fonts, sensible column widths, clear headings, and appropriate number formats, but applying one uniform format to everything isn’t necessarily an improvement. A report title, data header, user-input field, calculated result, and warning cell may intentionally have different formatting. The goal is not to make every cell identical, but to ensure the structure is understandable and consistent within each logical section.
Identify Formulas Before Removing Data
One of the easiest ways to damage a spreadsheet is to treat cells containing formulas as if they were ordinary values. A column filled with similar numbers might actually contain calculations that generate totals, statuses, percentages, lookup results, or other important information. If you’re uncertain which cells contain formulas, select them and check the formula bar, or use Excel’s Show Formulas option to display calculations across the worksheet.
Once you identify formula-heavy areas, pay attention to what those formulas reference. A formula may depend on cells elsewhere in the worksheet, another worksheet, a named range, or a table. That means deleting an apparently unused row or column can have consequences outside the area you are currently looking at. Before making a structural change, inspect the formulas around it and determine whether the cells you intend to remove are part of an active calculation.
Clean Up Blank Rows Without Automatically Deleting Them
Blank rows are among the most common sources of spreadsheet clutter, but they shouldn’t all be treated the same way. A single blank row between two sections may make a report easier to read, while dozens of accidentally inserted empty rows inside a dataset can interfere with sorting, filtering, and navigation. The question is not whether the row is empty; it is whether the row has a purpose.
If you’re working with a straightforward data table and find empty rows that clearly don’t belong there, removing them can make the dataset easier to manage. However, check the surrounding formulas and ranges before doing so. A blank row can still fall inside a formula range even when it contains no visible value. If you’re uncertain, hiding the row temporarily is a safer test than deleting it permanently.
Be Just as Careful With Empty Columns
Empty columns can create a similar problem. A column that appears blank may contain formulas that currently return an empty string, hidden information, or formatting associated with a particular workflow. It might also be included in a chart, named range, table, or other reference. Deleting it without checking can therefore produce a problem that doesn’t become visible until someone uses the workbook later.
If a column is clearly unnecessary but you’re not completely certain about its dependencies, hiding it first can be a useful compromise. This removes the visual distraction without destroying the underlying structure. If the workbook continues to work normally and the column has no legitimate purpose, you can make a more informed decision about whether permanent removal is appropriate.
Fix Inconsistent Formatting Selectively
Formatting is often the first thing people notice when a worksheet becomes messy, so it is tempting to select the entire sheet and apply a single style. That can make the result look cleaner, but it may also remove useful distinctions between different types of information. A better approach is to identify the formatting inconsistencies that genuinely make the worksheet harder to understand and correct those areas individually.
Pay attention to inconsistent fonts, random background colors, different number formats, irregular borders, and column widths that make values difficult to read. Dates should look like dates, percentages should be recognizable as percentages, and currency values should use an appropriate format. At the same time, preserve formatting that communicates meaning. If a particular color identifies cells that users are expected to edit, removing that color may make the worksheet technically cleaner but less usable.
Don’t Use Clear All When You Only Need to Remove Formatting
Excel’s clearing options can have unique effects, so choose them deliberately. If you only want to remove formatting, use a formatting-specific action rather than clearing the entire contents of the selected cells. Accidentally clearing formulas while trying to make a section look cleaner is one of the easiest mistakes to make during spreadsheet maintenance.
Before applying a bulk action, select a small representative area and confirm what will happen. This is especially important when working with mixed cells that contain formulas, manual entries, validation rules, or other features. Once you’re certain the command affects only what you intend to change, you can apply it more broadly if necessary.
Check Data Before Removing Duplicates
Duplicate-looking information doesn’t necessarily mean duplicate records. Two rows may contain the same customer name but represent separate purchases, or two entries may share a product code because that product appears in multiple transactions. Before using Excel’s Remove Duplicates feature, please consider what actually makes one record different from another.
For a customer directory, an email address or customer ID might determine uniqueness. In the case of an order log, the order number is likely the most appropriate choice. For transaction data, several columns may need to be considered together. The correct cleanup rule should be based on the meaning of the dataset, rather than on visual repetition alone. Once you have established what constitutes a duplicate, you can remove redundant records with considerably less risk.
Check Formulas Before Moving Columns
Reorganizing columns can make a worksheet much easier to navigate, but moving structural elements deserves more caution than changing their appearance. Excel can adjust many references automatically when cells are inserted or moved using normal commands, but complex workbooks can contain named ranges, external references, charts, and other dependencies that deserve additional checking.
If a column only needs to be moved because it is inconvenient to access, consider whether freezing panes, changing column widths, hiding an unnecessary field, or reorganizing the presentation area would accomplish the same thing. A cosmetic improvement does not always justify changing the physical structure of the data. When you do move columns, inspect important formulas immediately afterward rather than assuming Excel has preserved every relationship exactly as intended.
Don’t Sort a Partial Dataset
Sorting is another cleanup task that can quietly damage a worksheet when the wrong range is selected. Suppose a worksheet contains names in one column, account numbers in another, and balances in a third. Sorting only the name column would separate those values from their corresponding records. The worksheet may still look organized afterward, but the information would no longer belong together.
Before sorting, make sure the complete related dataset is included. If Excel asks whether you want to expand the selection, don’t simply accept the default without checking what is being included. This becomes particularly important when formula columns sit alongside manually entered information. A proper sort should keep each row’s related information together.
Review Tables Before Changing Their Structure
Excel Tables can be extremely useful because they provide filtering, structured references, automatic expansion, and consistent formatting. If a worksheet contains a regular dataset with a clear header row and records beneath it, converting the range into a Table may actually make future maintenance easier. New records can become part of the structure more naturally, and formulas can be easier to manage.
However, not every worksheet should be converted into a Table. A report with several separate sections, decorative headings, summary calculations, or presentation-focused layouts may not fit the Table structure well. Before making the conversion, understand whether the range represents one consistent dataset. If it does, a Table can reduce some of the manual maintenance that causes spreadsheets to become disorganized over time.
Pay Attention to Named Ranges
Named ranges are easy to overlook because they don’t always appear as obvious objects in the worksheet. A formula might refer to a name such as SalesData, TaxRate, or CurrentPeriod rather than a visible cell range. If you delete, move, or restructure the cells behind that name, you can unintentionally change what the formula uses.
Excel’s Name Manager provides a useful place to inspect these relationships. Before deleting important columns or moving data in a complex workbook, check whether named ranges point to the area you are changing. If a name is no longer needed, remove it only after confirming that no formulas, charts, or other workbook features depend on it.
Review Conditional Formatting Rules
Conditional formatting can also become messy over time. A workbook may accumulate several rules that were added for different reporting periods or copied from one section to another. Some rules may overlap, apply to unnecessarily large ranges, or no longer serve a useful purpose.
Use Excel’s conditional-formatting management options to inspect which rules apply to important areas. Look for duplicate or outdated rules and verify the ranges they affect. Don’t remove a complicated rule simply because it looks unnecessary, though. Conditional formatting may be the mechanism that alerts users to overdue items, unusual figures, missing information, or other exceptions that would otherwise be easy to overlook.
Protect Data Validation During Cleanup
Data validation is another feature that can disappear during careless cleanup. A worksheet might use dropdown menus to control values in a status column or restrict users to a specific type of entry. If you paste over those cells or clear them incorrectly, the visible values may remain while the validation rules disappear.
After cleaning any input area, test the controls that users rely on. Try the dropdowns, enter a normal value, and confirm that invalid entries are still handled as expected. A worksheet is only considered successfully cleaned if it looks better and retains safeguards that help people enter consistent information.
Inspect Hidden Content Before Deleting Anything
Hidden rows, columns, and worksheets deserve special attention because their contents are easy to forget. A hidden worksheet may supply data to a dashboard, while a hidden column might contain helper calculations or information used by a lookup. Even if nobody normally sees that content, it can still be part of the workbook’s functionality.
Before deleting hidden content, unhide it and determine why it exists. You may discover that some of it is genuinely obsolete, but you may also find important supporting information. If the hidden material is no longer necessary, consider documenting what you removed, particularly if other people maintain the workbook after you.
Be Careful With Merged Cells
Merged cells are often useful in report titles and presentation areas, but they can create problems inside datasets. A merged heading at the top of a report is usually harmless, while merged cells running through the middle of a data table can make sorting, filtering, and editing more difficult.
Rather than unmerging every cell, look at where merging is actually being used. If it is confined to titles and section labels, there may be no reason to change it. If merged cells are interfering with the way records are organized, consider redesigning that portion of the worksheet so each data field occupies its own consistent cell.
Review Charts After Cleaning the Data
Charts can continue displaying information even after their underlying source range has changed, which makes them easy to overlook during cleanup. If you remove rows, columns, categories, or historical data, verify whether the chart still represents the intended information. Confirm the source range, labels, series, and totals rather than simply checking whether the chart remains visible.
This is particularly important when the worksheet is used to prepare recurring reports. A chart that looks normal can still be misleading if its source data no longer matches the intended period or category. After significant cleanup, compare important charts with the original version or with the underlying data to ensure that nothing important was accidentally excluded.
Check the Workbook After Every Major Change
One of the safest habits you can develop is to avoid making every cleanup change at once. If you remove several columns, change a table structure, delete old records, and modify formulas before checking anything, you may have difficulty determining which action caused a problem.
Instead, make a meaningful change and then check important formulas and results. Look at totals, lookup outputs, summary cells, charts, and other areas that depend on the section you modified. If something changes unexpectedly, you know which stage of the cleanup to investigate.
This approach takes slightly longer than performing a massive cleanup in one pass, but it dramatically reduces the difficulty of finding mistakes. It also makes the process easier to reverse because each stage has a known state.
Compare Important Results With the Original
Before declaring the cleanup finished, compare important results with the original workbook. You don’t necessarily need to compare every single cell. Focus on totals, counts, key lookup results, percentages, summary figures, and other outputs that people actually rely on.
If a total changed, check whether that change was intentional. If a lookup result changed, find out why. A different result isn’t automatically evidence of an error because you may have deliberately removed outdated data, but every unexpected difference deserves an explanation.
For particularly important workbooks, compare the cleaned spreadsheet against an independent source as well. Matching the original workbook only proves that you preserved its previous calculations; it doesn’t prove that those calculations were correct.
Keep Historical Information Out of the Way Rather Than Destroying It
Old records often make a worksheet feel crowded, but that doesn’t mean they should be deleted. You may still need previous transactions, inactive customers, older inventory, or earlier reporting periods for comparisons or audits. If those records aren’t required in the active working area, moving them to a suitable archive can be a better solution than permanently removing them.
Before moving historical information, verify whether formulas or reports depend on those records. A summary calculation may include several years of data even if users normally view only the current year. If you separate the historical records, please ensure that the formulas are updated intentionally to avoid any issues due to missing source data.
Finish With an Error and Formula Check
Once the visible cleanup is complete, inspect the workbook for formula errors and unexpected changes. Look for common Excel errors such as #REF!, #VALUE!, #DIV/0!, #N/A, #NAME?, #NUM!, and #SPILL!, depending on the formulas and Excel version you are using. A structural change can create an error somewhere other than the cells you directly modified, so don’t limit the final check to the area you cleaned.
It is also useful to compare several important formulas with the original workbook. If a formula changed because you deliberately reorganized the data, confirm that the new reference is correct rather than assuming Excel handled everything automatically. The disappearance of an error doesn’t necessarily mean the workbook is fixed; a formula can return a perfectly plausible number while referencing the wrong data.
Save the Clean Version Separately
When the cleanup is complete and the workbook has passed your checks, save the cleaned version separately from the original. A clear filename or version-history system makes it easier to identify which file is current and gives you a recovery path if a problem is discovered later.
Keep the original according to the needs of the project or organization rather than deleting it immediately. This is particularly important when the spreadsheet contains historical records or calculations that other people may need to verify. A clean workbook is useful, but a clean workbook with a recoverable history is considerably safer to maintain.
Clean the Worksheet Without Losing What Makes It Work
A successful Excel cleanup isn’t measured by how much content you manage to delete. The real improvement comes from making the worksheet easier to navigate, easier to understand, and easier to maintain while preserving the calculations and relationships that make it useful. Removing unnecessary clutter can help, but removing a supporting range or formula simply because it looks untidy can create a much bigger problem.
The safest process is straightforward: make a copy, inspect the structure, identify genuine clutter, change one area at a time, and verify the results afterward. Treat formulas, tables, named ranges, validation rules, charts, and hidden content as connected parts of the workbook rather than isolated cells.
When you approach cleanup this way, you don’t have to choose between a tidy worksheet and a functioning one. You can improve the appearance and organization of the workbook while keeping its calculations intact—and, just as importantly, make it easier for the next person to understand what the spreadsheet is actually doing.
Frequently Asked Questions
Can cleaning an Excel worksheet break existing formulas?
Yes. Deleting referenced cells, moving data, overwriting formulas, changing ranges, or removing supporting worksheets can affect calculations. Creating a copy and checking dependencies before structural changes greatly reduces the risk.
Should I delete blank rows from an Excel worksheet?
Only when you know they are unnecessary. Some blank rows separate sections or fall inside ranges used by formulas, tables, charts, or other workbook features.
How can I identify formulas before cleaning a worksheet?
Select cells and inspect the formula bar, or use Excel’s Show Formulas feature when you need to see calculations throughout the worksheet. This helps distinguish calculated cells from manually entered values.
Is it safe to remove duplicate rows?
Only after determining what makes a record unique. Two rows that look similar may represent separate transactions or legitimate entries, so define the duplicate criteria before using Excel’s Remove Duplicates feature.
Can I delete hidden columns if they appear unused?
Check them first. Hidden columns can contain helper calculations, lookup data, or information used by charts and formulas. If you’re uncertain, temporarily unhide or simply leave the column hidden.